In a comment on Mora et al. (2013), we highlight some errors the authors make in calculating and expressing the uncertainty in the timing of “climate departure” – the time at which a particular place on Earth will see a climate unprecedented in the historical record. There is a reply by the authors of the original article, and a News and Views piece from an independent scientist.
The lead author of our comment, Ed Hawkins, will be discussing things in depth, and breadth, over at climate lab book.
I think that one of the most important errors in the original article is that the authors overestimate the precision (underestimate the uncertainty) with which we can estimate the timing of climate departure.
Mora et al. confuse an uncertainty estimate for the mean of a distribution, with an an uncertainty estimate for a single future event. They express the uncertainty of their index as a standard error, sigma/sqrt (N), where sigma is the standard deviation of an ensemble of climate simulations, and N is the number of ensemble members.
The easiest way to see the mistake is to think about what happens as they get a larger and larger ensemble of climate simulations. In their setup, if we had an infinitely large ensemble we would know the timing of emergence of an unprecedented climate with no uncertainty! This is clearly not credible, given that there is random natural variability in the Earth system, and the fact that models are not perfect.
Why is this important?
The actual timing of climate departure in any place might be much earlier or much later than expressed in Mora et al. It is important that people making decisions about adapting to climate change are aware of this, as it might seriously affect climate policy.
For example, policy makers with responsibilities for adapting infrastructure might get surprised by an unprecedented climate event, or they might waste money by building in climate change resilience before they need to.
There is also a risk that decision makers caught out in this way would lose trust in valuable climate information, to the detriment of all.
What is wrong here?
A simple analogue to the problem is trying to predict the height of a person, compared to predicting the average (mean) height of a group of people that walk into a room.
Say you’ve been sitting in a room all morning, and 39 people had joined you. What will the height of the next person who walks into the room be? A good estimate is the average (mean) of those 39 people.
Hang on a moment though – there will be some uncertainty about that estimate. Suppose a different 39 people had joined you: that estimate of the mean would be very slightly different. This is the uncertainty of the mean, and it comes from the fact that you only have a sample of the population. You get more sure about the estimate of the mean as the number of people you have already seen goes up – this is why poll and surveys are large* (often about 1000 people).
However, when the next person walks in, they might still be quite different from your estimate! They will also probably be outside of the range defined as the uncertainty of the mean.
This is because the heights of people are drawn from some underlying distribution. To make a prediction for a single person, we need to know some estimate of the spread, or uncertainty of that underlying distribution.
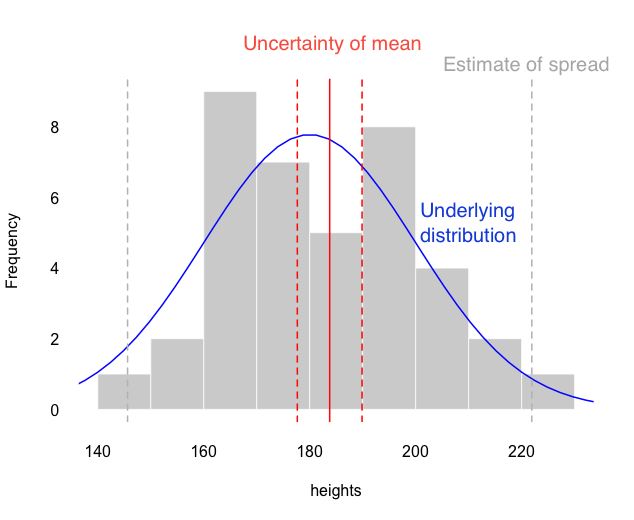
Estimating an underlying distribution (blue), using a sample (grey histogram). The best estimate of the mean is the solid red line. The uncertainty of the mean (red dashed lines) is much smaller than the spread of the underlying distribution (grey dashed lines).
Thinking about the future Earth system
Imagine we were to get all of the very best climate modellers into a room to build the bestest super-whizzy new climate model ever. In fact, it is so good, that it might as well be called EARTH-1.1 (to distinguish it from EARTH-1.0, which is where you are sitting right now).
It has never been run before, and everyone is very excited to switch it on and see if it works.
The model is so complex and detailed that the modellers can only run it once, projecting the climate under a scenario of greenhouse gas emissions – say RCP4.5. Could we predict when the climate at a certain place experience an “unprecedented climate” in the whizzy EARTH-1.1, using information that we have already? This is known as a perfect model experiment, and is a useful check on our methods for climate prediction.
Say, we had 39 simulations, from a number of our – considerably less whizzy – climate models, with which we could make a prediction of the year of “unprecedented climate” for London, UK. What is the “best estimate” of when that would happen, and how could we calculate it?
We know that there are three fundamental uncertainties in predicting climate – the forcing (largely due to greenhouse gases and other human behaviour), the response of the climate to that forcing, and natural variability (like weather). In this scenario, we can ignore the uncertainty in forcing, as we know that perfectly – it is RCP4.5. We just need to worry about the climate response and the natural variability.
A simple way – assuming that all of the non-whizzy climate models were equally good – would be to just take the average of the simulations. That would give us our “best estimate”, mu.
But hang on – we know that the uncertainty in EARTH1.1 will be a combination of response to forcing, and natural variability. If we were to run all of those 39 climate models again, we’d get a slightly different “best estimate”, mu, right? How different? Well, given some assumptions, that uncertainty is worked out using the standard error, and it goes down as the number of climate simulations goes up.
BUT, we’re not really interested in that uncertainty, we’re really interested in what happened in the single run of EARTH-1.1. The estimate of uncertainty doesn’t go down in the same way, as the number of ensemble members gets larger – for two reasons.
First, the non-whizzy climate models might be slightly wrong in the same way (model bias, or discrepancy). They might have a lower resolution than EARTH-1.1, or be missing some process that is important at the local level. If that was the case, even if they all converged to the same answer, it would be different from EARTH-1.1, and we’d have to take that into account in our uncertainty estimates.
Second, the “natural variability” is still present in the single EARTH-1.1 run. That uncertainty is best estimated by sigma, and the single run will be drawn from that underlying distribution. No matter how many ensemble members we run, this uncertainty doesn’t reduce to zero.
We can estimate that natural variability though – we have 39 non-whizzy climate models, all with their own internal variability. If we make the assumption that they represent the natural variability in EARTH-1.1 well, then we can account for that in our prediction of the timing of an unprecedented climate.
Now, it’s not really so much of a stretch to imagine that EARTH-1.1 and EARTH-1.0 are similar. Really really similar. We can imagine a situation, say, where the new climate model runs at one model year per calendar year. And the outcome is far from academic.
Notes
* Full disclosure: my partner works for Select Statistics – they are awesome, hire them.
Thanks to Ed Hawkins for providing feedback on a draft of this post.


[…] Yesterday saw the publication of our Comment on Mora et al., along with Mora et al.’s Reply and an associated ‘News & Views’ piece. Although the Editors deserve credit for commissioning a News & Views piece on this exchange – a first for a Comment in Nature – there are still errors in Mora et al.’s Reply. A previous post summarised the issues with the original paper, and Doug McNeall also comments. […]