Tag Archives: R

Visualising input spaces using emulators
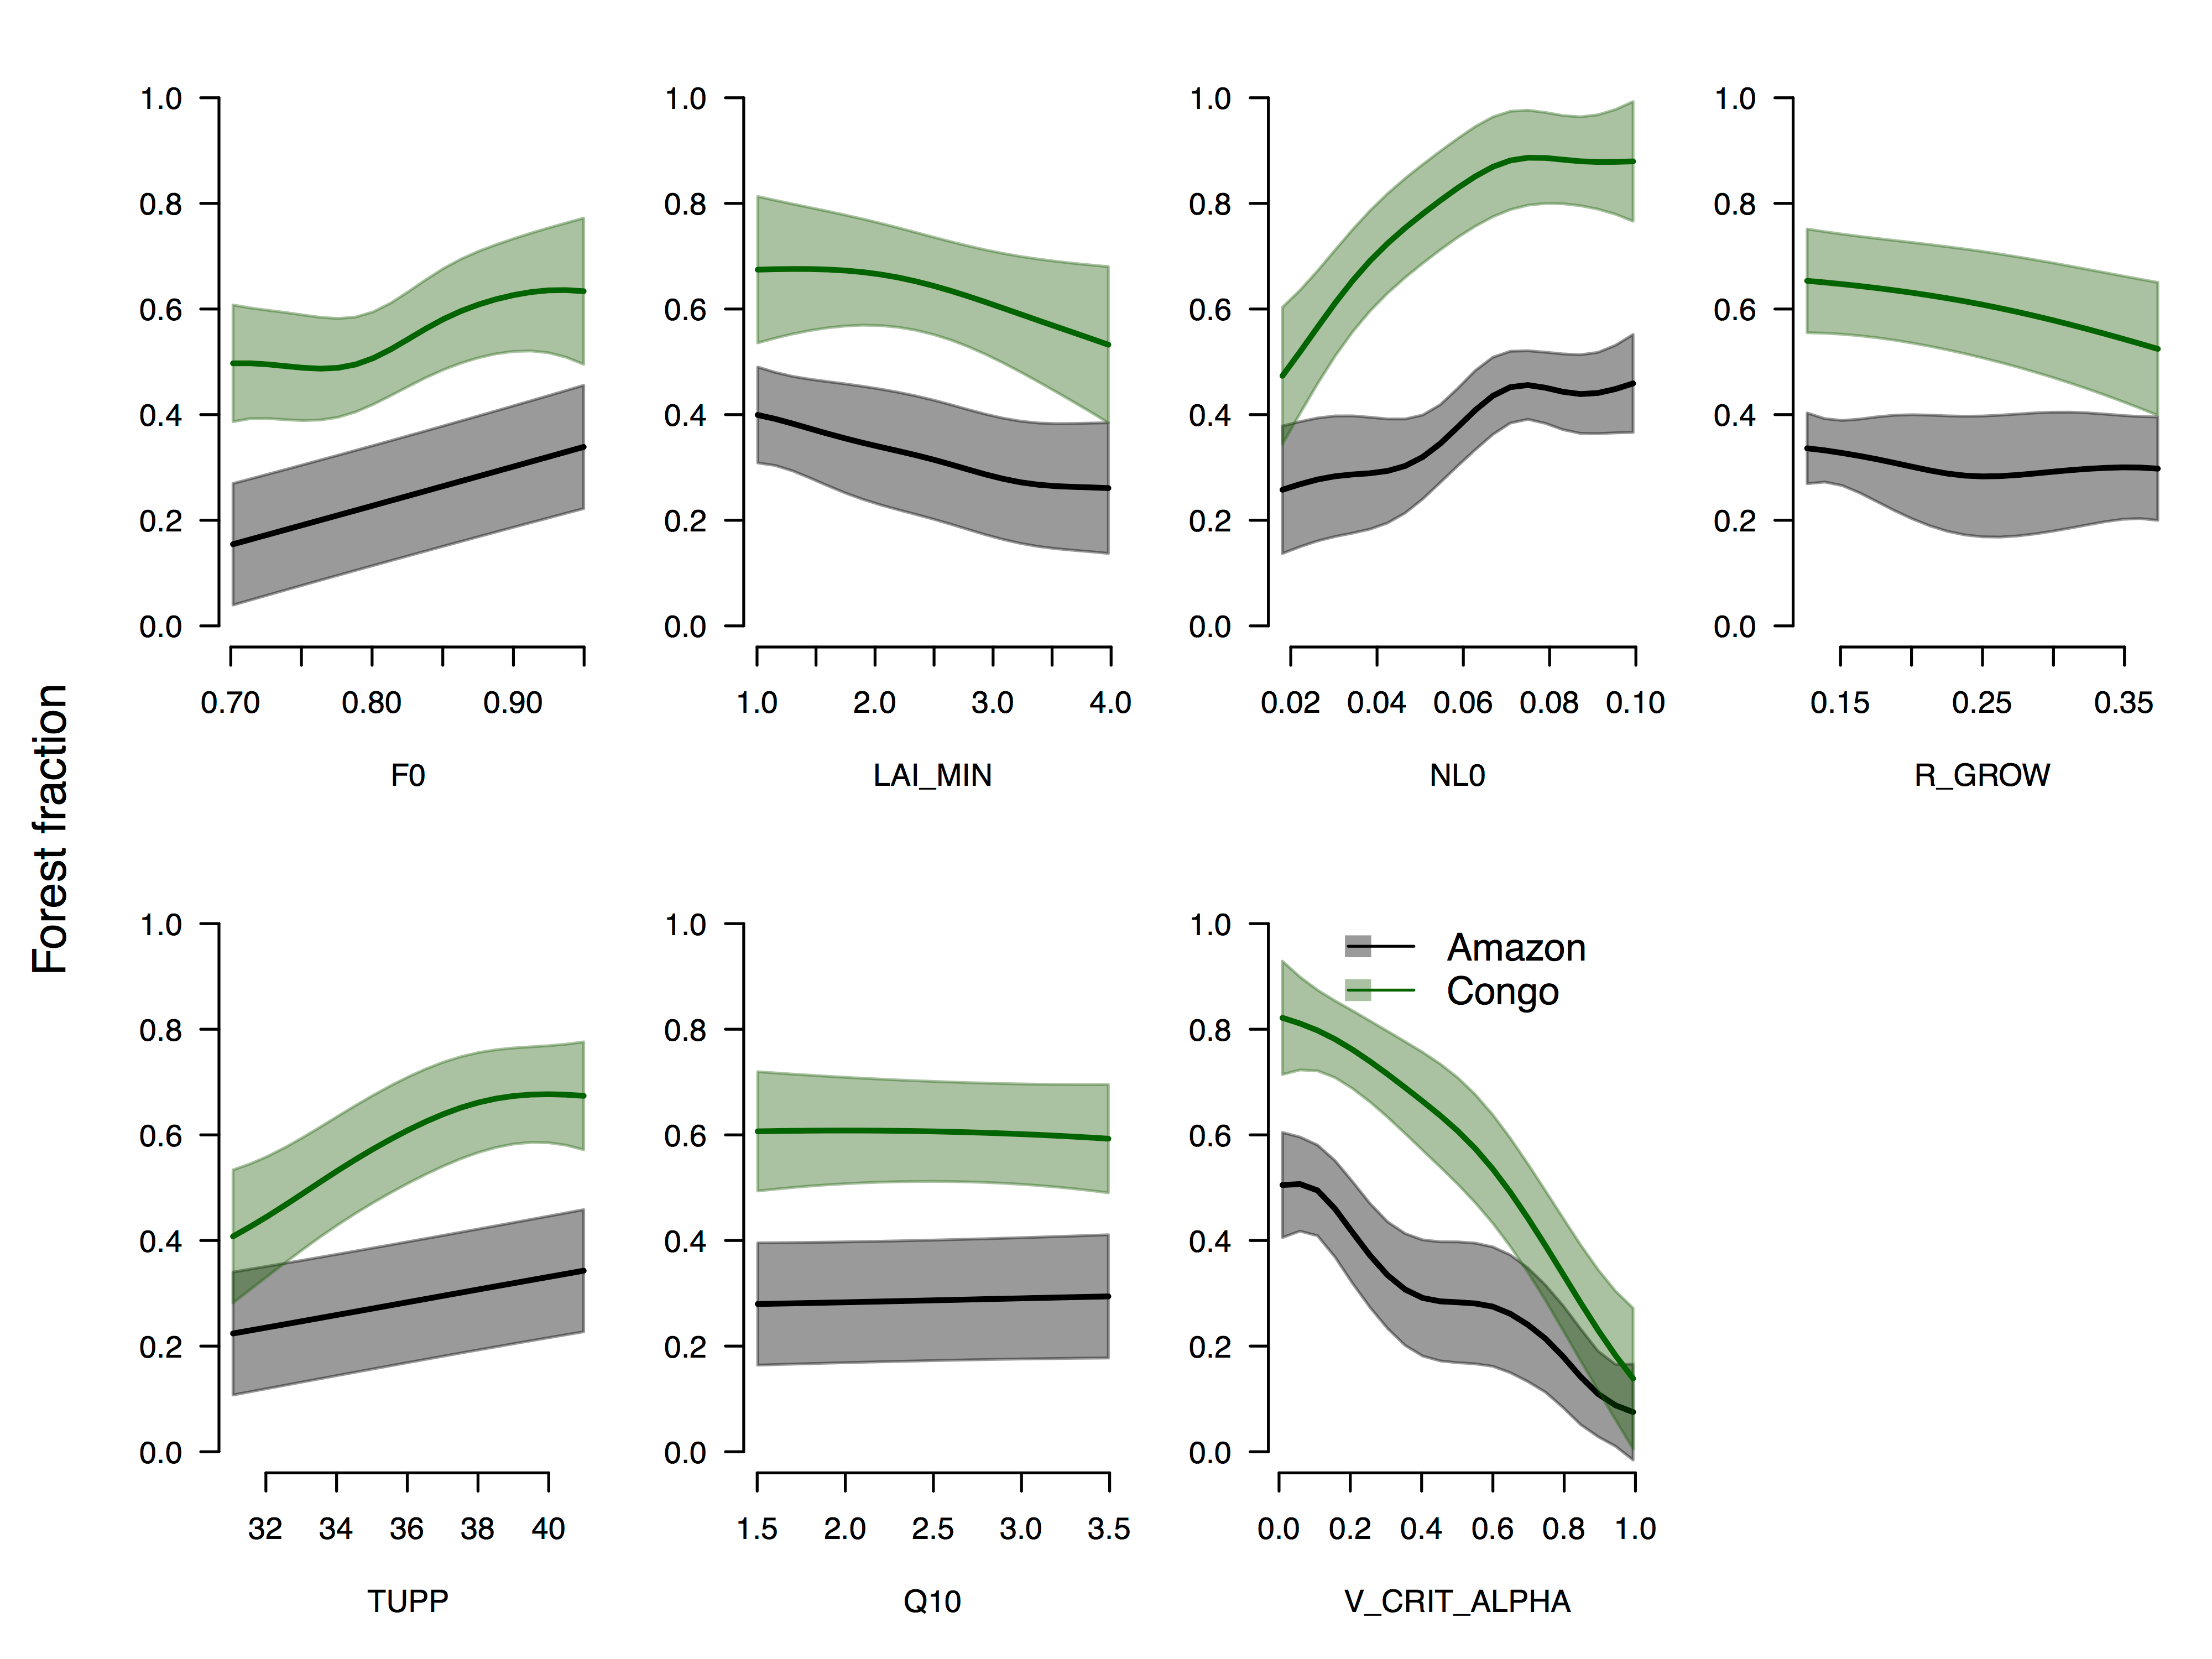
In a previous post, I looked at some of the ways we could visualise the input space of climate models, when they are constrained to produce behaviour that looks something like the real world. I used parallel co-ordinates plots and pairs plots to visualise the high (32) dimensional input space of the JULES land surface […]
Sensitivity analysis with R
After last week’s post, I thought it might be useful to have some practical examples of how to do sensitivity analysis (SA) of complex models (like climate models) with an emulator. SA is one of those things that everyone wants to do at some point, and I’ll be able to point people here for code […]


